AYOKANMI CARLTON OLUDOLA
QUARTERLY BUSINESS PERFORMANCE OVERVIEW
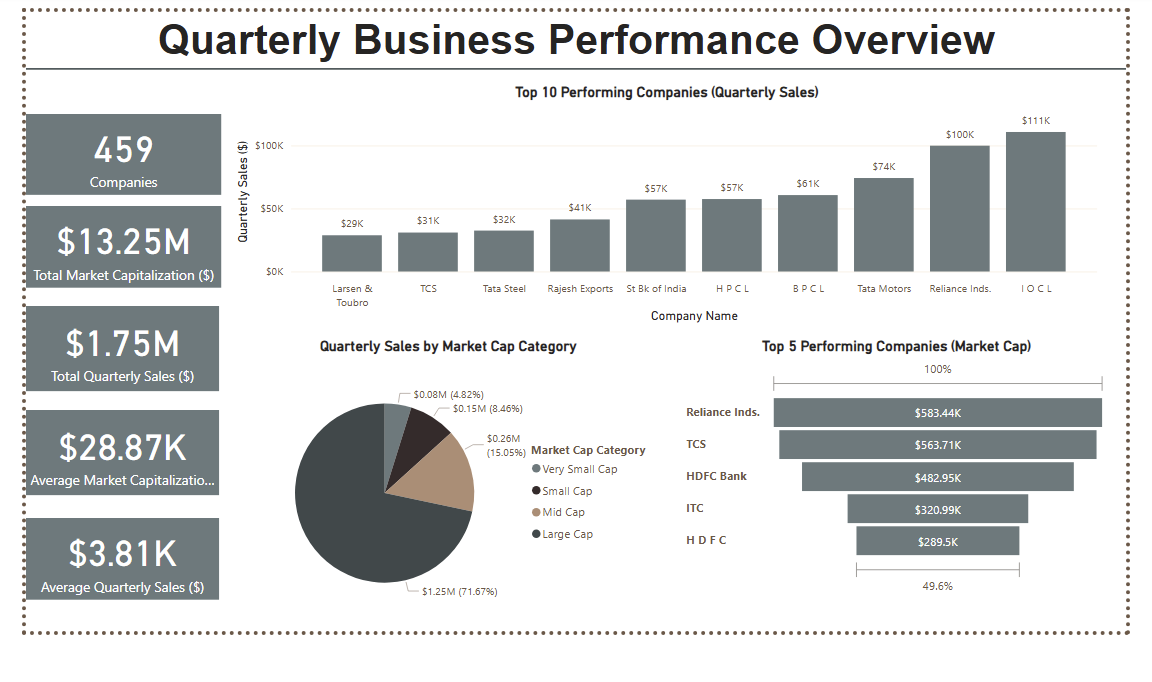
A data‑driven look at Q1 performance across 459 public companies, highlighting market capitalization, sales distribution by cap‑tier, and standout industries driving value and growth.
Industry: Finance
Project Background: This analysis examines 459 companies in India to uncover performance patterns, identify top performers, and analyze sales distribution across different market capitalization tiers. The insights gained aim to support data-driven business decisions and contribute to growth strategies.
My Task As A Data Analyst: Evaluate sales and market data to identify key performance drivers, compare trends across market capitalization tiers, and create actionable visualizations to guide strategic business decisions.
Skills: Data wrangling,Trend analysis,Financial Acumen,Data Exploration,ETL,Advanced DAX functions,Problem Solving,Data visualisation, Story telling.
Tools/Libraries: Excel, Power Bi.
Insights:
TOP PERFORMERS: POWERHOUSES OF GROWTH
Key Findings:
- Large-cap companies made up 71.67% of total quarterly sales, contributing $1.25 million out of the $1.75 million total.
- Mid-cap companies were responsible for 15.05% of sales.
- Small-cap and very small-cap companies contributed 8.46% and 4.82%, respectively.
- The overwhelming contribution of large-cap firms underscores their economic weight and stability in driving the broader market.
SALES DISTRIBUTION: THE SOCIAL ADVANTAGE
Key Findings:
- The industries leading in sales include Oil & Gas, Conglomerates, Automotive, Banking & Financial Services, Gold & Jewelry, Steel & Mining, IT Services, and Engineering & Construction.
- The top industries by market capitalization are Conglomerates (Oil, Retail, Telecom), IT Services, Banking & Financial Services, and Financial Services (e.g., Housing Finance).
- The overlap between leading industries in market capitalization and sales reveals their significant role in both revenue generation and strategic importance within the economy.
INDUSTRY LEADERS: WHERE THE MONEY FLOWS
Key Findings:
- The industries leading in sales include Oil & Gas, Conglomerates, Automotive, Banking & Financial Services, Gold & Jewelry, Steel & Mining, IT Services, and Engineering & Construction.
- The top industries by market capitalization are Conglomerates (Oil, Retail, Telecom), IT Services, Banking & Financial Services, and Financial Services (e.g., Housing Finance).
- The overlap between leading industries in market capitalization and sales reveals their significant role in both revenue generation and strategic importance within the economy.
Outlier Insight: The Case of Bajaj Holdings
Key Finding:
- Bajaj Holdings is a notable outlier: while it has a large market capitalization, its sales performance is surprisingly low.
- Although data limitations hindered a deeper analysis, this anomaly suggests that further exploration into the company’s financial health and operational dynamics may be necessary.
Analysis:
The Powerhouses of Growth: Top Performers Revealed
The data set includes 459 companies with a combined market capitalization of $13.25 million and total quarterly sales of $1.75 million. Analyzing this pool, the top 10 companies by quarterly sales and the top 5 companies by market capitalization stood out. A striking observation was the overlap of two key players—Reliance Industries and TCS—appearing on both lists. This convergence highlights their consistent, high-performance across both market capitalization and sales, underlining their strong position as industry leaders. This overlap suggests a clear relationship between market dominance and revenue strength, where companies excelling in one area tend to dominate the other as well.
Sales Distribution: The Advantage of Scale
One of the most striking takeaways from the analysis was the sales distribution across market capitalization tiers. The large-cap companies emerged as the dominant force, driving a massive 71.67% of total sales, which equals $1.25 million. In comparison, mid-cap companies contributed 15.05%, while small-cap and very small-cap companies were responsible for only 8.46% and 4.82%, respectively. This concentration of sales within the large-cap segment signals the economic weight these companies hold in the broader market, and underscores their stability and financial strength. These larger firms clearly have the scale to generate the most revenue, which is a sign of their strategic dominance in their respective sectors.
Industry Leaders: Where the Money Flows
The industry-level breakdown also revealed interesting trends. The sectors leading in sales were those like Oil & Gas, Conglomerates (Oil, Retail, Telecom), and Automotive, which have historically shown strong growth. Meanwhile, the top industries by market capitalization included sectors like Conglomerates, particularly in oil, retail, and telecom, alongside IT Services and Banking & Financial Services. This data supports the idea that market value and revenue generation are often tied to each other, as industries that excel in valuation also tend to lead in sales. This trend emphasizes the strategic importance of these industries in driving overall economic growth.
Bajaj Holdings: A Curious Outlier
One outlier that caught the eye was Bajaj Holdings. Despite its significant market capitalization, the company’s sales performance was surprisingly low. This discrepancy could be due to various factors—perhaps inefficient operations or specific market challenges that hinder sales growth. However, without sufficient data to draw concrete conclusions, this anomaly suggests an area for further investigation. Given Bajaj’s market presence, it’s worth digging deeper into this company’s structure and financial performance to understand why it’s diverging from the norm.
Conclusion: A Clear Market Pulse
The analysis paints a clear picture: IT Services, Oil & Gas, and Banking & Financial Services are the dominant players in the market, both in terms of market capitalization and sales. These sectors have proven to be the backbone of the economy, where market confidence and revenue generation go hand-in-hand. The large-cap companies in these sectors continue to drive market stability, while industries like IT services and conglomerates maintain their role as key drivers of growth. This trend of economic leadership is likely to continue, solidifying these sectors as integral to the long-term success of the market.
- © Ayokanmi Inc. All rights reserved.